
Liquefied natural gas and the energy transition: The methane challenge
- Liquefied natural gas (LNG) is increasingly under the spotlight, for geopolitical reasons, energy security and concerns around its greenhouse gas footprint
- LNG accounts for 14% of global gas demand and the market has grown at more than 6% per annum for more than 20 years, with the US the largest exporter since 2023
- Methane is a key source of greenhouse gas emissions in the oil and gas and LNG value chains, and methane leakages are the main cause of the high emission intensity of US LNG
- LNG can play a role in the energy transition, mostly to displace coal, if methane emissions are kept at a minimum
- Drastically reducing methane emissions is doable technically and economically
- We believe investors, insurers and lenders must ask companies to cut methane emissions to near zero, and only direct their capital towards those changing their practices and making progress in this aim

Head of Climate Research
Russia’s 2022 invasion of Ukraine prompted Europe to sharply re-evaluate its energy strategy. Before the crisis, piped Russian gas accounted for around of 40% of European Union (EU) gas imports1 - subsequently, the EU started to massively increase its liquefied natural gas (LNG) imports, largely from the US. This put LNG firmly in the spotlight in terms of the debate around the energy transition. Many questions were asked; what is LNG? Is LNG clean? Is LNG a good alternative to Russian gas? Is natural gas a transition fuel? What is the problem with methane?
The overall energy ecosystem is complex, and LNG is no exception. In this paper, we will explain what LNG is, where its greenhouse gas emissions come from, why US LNG is different, and what it means for investors.
- {https://ec.europa.eu/commission/presscorner/detail/en/qanda_22_1512;Questions and Answers on REPowerEU}
What is LNG?
What we call natural gas2 is mostly methane: one atom of carbon and four atoms of hydrogen (CH₄) and the smallest molecule of the alkane family. Raw natural gas, when it comes out of wells, is usually a mixture of methane, other alkanes (primarily ethane, propane and butane) and ‘impurities’, mainly carbon dioxide (CO2), mercury and hydrogen sulphide (H2S). Once this raw gas is processed – impurities removed, and alkanes separated - it is then called dry gas and is made of almost pure methane1. This is what goes into gas networks and feeds power plants, industrial furnaces, and home boilers.
LNG is simply methane in a liquid form. The benefit of turning natural gas into a liquid is that it takes up about 600 times less space and can be transported in ways a gas cannot - especially overseas in dedicated ships. This is indeed the main raison d’être of LNG: connecting producers and consumers of gas in regions separated by oceans.
- During the industrial revolution, the first gas used was made from coal and hence called coal gas or city gas. When gas started to be produced by the oil and gas industry, the term ‘natural’ was added to distinguish this gas from its predecessor. Natural gas is now also called fossil gas or methane gas.
- Depending on the geographies, certain amounts of alkanes, mostly ethane, butane or propane, can be left in the gas stream
Why does methane liquefy at low temperatures?
Gas molecules ‘shake’ because of their kinetic energy. When the temperature drops, the kinetic energy drops as well, and the shaking is reduced. This gives more room for intermolecular forces, notably the so-called Van der Waals forces (forces that attract neutral molecules to each other), to pull the molecules closer together. At a low enough temperature, this leads to a transition from a gaseous to liquid state. For methane, this threshold is -162.5°C or -260°F. Liquefaction happens at atmospheric pressure. It is also possible to liquefy a gas by massively compressing it.
The natural gas and LNG markets
Natural gas demand was just over four thousand billion cubic metres (bcm) in 2023, double the level in 1991 and up by two-thirds since 2000, according to the Statistical Review of World Energy3. Cross-border trade, through pipelines and as LNG, accounted for 22%-25% of total consumption over the past quarter century. However, while pipelines accounted for more than 70% of traded gas in 2000, that figure is below half today (see figure 1).
Figure 1: World natural gas consumption and share of cross-border trade

Source: Statistical Review of World Energy 2024
The International Energy Agency’s (IEA) World Energy Outlook 20244 reported that 39% of natural gas is used to generate electricity, 22% by the industrial sector, 19% in buildings, and the remaining 19% across the economy, including a small part in transportation.
LNG production has grown at a strong pace since the first commercial liquefaction plant was built in the 1960s. The market grew to 100 million tonnes (MT)5 in 2000 and has quadrupled since then. LNG now accounts for 14% of total gas demand. Figure 2 shows the development of LNG exports in recent decades and highlights the rising market shares of the current main producers - the US, Australia and Qatar which together supply 60% of the world’s LNG.
Figure 2: LNG exports over 2000-2023, in million tonnes
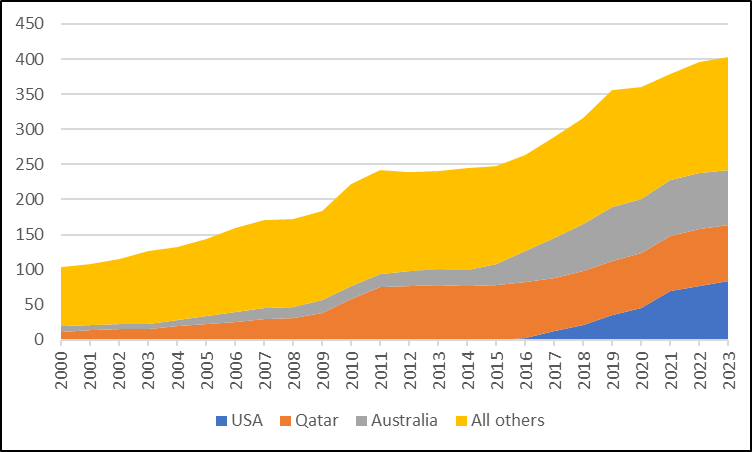
Source: Statistical Review of World Energy 2024
Between 2000 and 2023, natural gas demand has grown at a 2.3% compound annual growth rate while LNG grew at 6.1%. We note the market’s growth since the first US LNG exports (in 2016) was on trend, as Qatar’s volumes reached a plateau around 2013-2014.
- https://www.energyinst.org/statistical-review
- {https://iea.blob.core.windows.net/assets/fb481b31-df88-4f2c-a435-c8b075e992be/WorldEnergyOutlook2024.pdf;World Energy Outlook 2024}
- The main metric in LNG is the metric tonne and volumes are measured in million tonnes or MT. 1 MT is equivalent to 0.735 bcm
The LNG value chain
Figure 3 presents a simplified view of the LNG value chain.
Figure 3: The LNG value chain
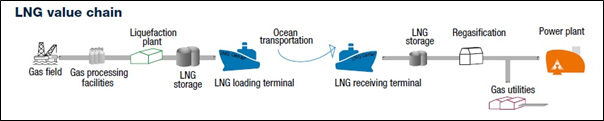
Source: Liquefied Gas Carrier
In most cases, natural gas flows from wells to the end customers through a network of variously sized pipelines – from small gathering tubes in the fields to large trunklines sometimes thousand-plus kilometres long.
For LNG, there are three additional steps: liquefaction, shipping, and regasification.
Liquefaction: A liquefaction plant is called a ‘train’ in the industry lingo. There can be one or more trains on a given site. There are different liquefaction technologies available, but they all follow the same logic:
- Dry natural gas is circulated in coiled tubing. Any trace of water must have been removed
- At the same time, a refrigerant is passed through a compression/expansion phase in a heat exchanger
- When the two circuits cross, the refrigerant takes heat from the natural gas
- After several iterations, the gas has been cooled enough to become liquid
In other words, an LNG train functions like a freezer on a massive scale.
The world’s total liquefaction capacity stood at 483MT at the end of 20236 and moved above 500MT in 2024 with the startup of new capacities in the US, with plants in 21 countries.
Transportation: Once liquefied, the gas is loaded into dedicated ships - methane or LNG tankers. These vessels are equipped with specialised insulation equipment to keep the LNG cold and liquid. During the trip, a small amount of LNG will evaporate or boil off - common practice is to reliquefy this or to use it to fuel the ship.
At the end of 2023, there were 668 LNG tankers in operation, with an additional 81 expected to be delivered in 20246. Nearly half (46%) of those vessels have a capacity in the 170-210 thousand cubic metres (kcm)– equivalent to 125-155KT of LNG – while 20% are in the 150-170kcm range and 29% in 90-150kcm.
Regasification: Once LNG reaches its destination, it must be turned back into a gas. This regasification process is the reverse of liquefaction, although it requires much less energy. Heat is taken from an external source, most often seawater, so that the LNG returns to a gaseous state.
This largely happens in land facilities but can also take place in so-called floating storage regasification units (FSRU), which are in practice modified LNG tankers anchored near the shore. In both cases, the facilities are connected to pipelines that will bring the natural gas to the end customers.
Globally, there were 48 LNG importing countries at the end of 2023, and 1,143MT of regasification capacity (more than double total liquefaction capacity), including 187MT in 51 FSRUs6.
- GIIGNL - 2024 Annual Report
- GIIGNL - 2024 Annual Report
- GIIGNL - 2024 Annual Report
Emissions from the LNG value chain
Going back to the LNG value chain in figure 3, we can identify the main emission sources at different stages:
- Pre-liquefaction: Upstream (extraction), gathering and transportation, and processing7. Energy is required to power the machines, compressors and various equipment used to extract gas from underground, process it and transport it. During this phase, methane leaks are a significant source of emissions, sometimes greater than the CO2 generated by running the equipment itself
- Liquefaction: Cooling the gas is an energy-intensive process. The IEA estimates that some 9%-10% of the natural gas feeding an LNG plant is used to power the process8. Open-cycle gas turbines are commonly used and can emit up to 250kg of CO2 per tonne of LNG. The process can be fully electrified, reducing on-site emissions by transferring them to power generation. The emissions footprint will then depend on the power mix. A fully renewable power source can lead to a 90% decline in emissions9
- Post-liquefaction: Shipping and regasification. LNG tankers will emit greenhouse gases through burning fuels – the more the longer the distance travelled – and a regasification plant will require some energy, although an order of magnitude less than for liquefaction
While the industrial processes are clear, the emissions data is much less so. Companies involved in the LNG value chain are not so transparent and usually only provide discrete data points and no overall view of emissions. We looked at many sources and found very diverse numbers. A key challenge comes from the lack of bottom-up data and the strong reliance on modelled emissions - both for emissions at various stages of the value chain and for life cycle analysis – rather than measured emissions.
A key variable - and the main source of uncertainty - is the quantum of methane leaks, especially upstream. While CO2 emissions from the various combustion processes can be assessed with a good accuracy, methane leaks are asset dependent and vary at the micro-local scale.
We present here a sample of what we consider sufficiently reliable sources and data points, fully acknowledging that this is a small part of a rich body of work.
International Energy Agency: In a November 2023 report10, the IEA provided an analysis of emissions by the oil and gas industry, with a specific sub-analysis for LNG. It estimated that in 2022 the industry emitted 5.1 gigatonnes (GT) of CO2 equivalent (CO2e), including methane emissions. Producing natural gas led to emissions of 1.7GT, meaning an average emission intensity of 65kg CO2e per barrel of oil equivalent (boe) 11, with two-thirds of those emissions coming from methane leaks. A striking observation is that best-in-class performance is eight-to-10 times better than worst-in-class.
Regarding LNG, emission intensity is higher than for natural gas in general because of the additional steps in the value chain. Figure 4 presents the IEA’s conclusions. LNG is about 15%-20% more intensive, hence around 80kg/boe or 640kg per tonne of LNG, with a wide range from 400kg to far above 1,000kg.
Figure 4: Intensity curve of LNG
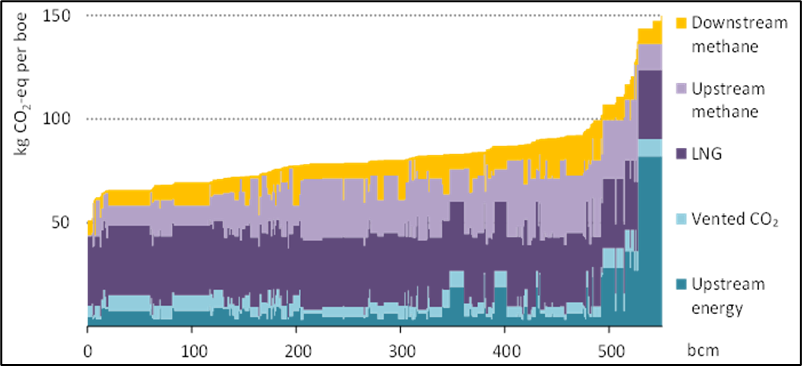
Source: The Oil and Gas Industry in Net Zero Transitions, IEA; 2023
WoodMac: WoodMac is a well-known natural resource consultancy. Using its own modelling tool, WoodMac highlights the wide intensity range across and within regions and countries. The US stands out as a high intensity LNG producer – see figure 512.
Figure 5: Greenhouse gas emissions intensity from the wellhead to loading point
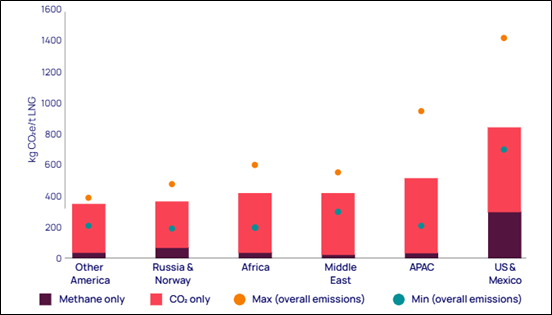
Source: LNG Emissions, WoodMac, March 2024
International Maritime Association (IMO): The IMO released a literature review13 of well-to-tank emissions from LNG imported in Europe, containing a wealth of complex data points. In figure 6 we present a sample of data based on the most recent Intergovernmental Panel on Climate Change (IPCC)’s warming factors14. This study of studies has the benefits of providing data points containing an average intensity, but also median, standard deviation and significant percentile levels. Again, it shows a wide range of intensities and a dramatically higher intensity level for US LNG.
Figure 6: Emissions intensity of LNG delivered to Europe
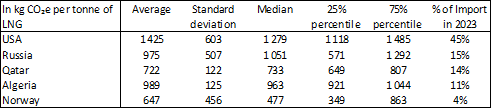
Source: Literature Review on Well-to-Tank emissions from LNG imports to EU; studies using the IPPCC’s AR6 GW100 factors
These three studies reach several common conclusions, supported by other analyses we consulted:
- There are significant differences in intensities across and within regions and countries
- Methane emissions are the key differentiating factor and vary significantly place by place
- The US is a high intensity LNG producer
- For LNG outside the US, processing is usually done at the liquefaction site. In the US, processing is usually done in separate facilities, although additional deeper processing can be carried out on the liquefaction sites
- {https://iea.blob.core.windows.net/assets/2f65984e-73ee-40ba-a4d5-bb2e2c94cecb/EmissionsfromOilandGasOperationinNetZeroTransitions.pdf;Emissions from Oil and Gas Operations in Net Zero Transitions, IEA, 2023}
- {https://totalenergies.com/news/press-releases/oman-totalenergies-launches-marsa-lng-project-and-deploys-its-multi-energy;Oman: TotalEnergies launches the Marsa LNG project and deploys its multi-energy strategy in the Sultanate of Oman | TotalEnergies.com}
- {https://iea.blob.core.windows.net/assets/f065ae5e-94ed-4fcb-8f17-8ceffde8bdd2/TheOilandGasIndustryinNetZeroTransitions.pdf;The Oil and Gas Industry in Net Zero Transitions, IEA, 2023}
- One bcm is equivalent to 0.17boe and one tonne of LNG is equivalent to 8 boe
- WoodMac also provides shipment specific intensity data for Japan’s LNG imports. See figure 2 in Japan’s LNG decarbonisation challenge
- {https://cleanarctic.org/wp-content/uploads/2024/09/ISWG-GHG-17-3-Literature-review-on-well-to-tank-emissions-fromliquefied-natural-gas-LNG-imports-to-the.-CSC.pdf;Literature Review on Well-to-Tank emissions from LNG imports to EU, Energy & Environmental research Associates, August 2024}
- There are several tables with older emission factors in the full report, but they convey the same message
US LNG: A world of its own
The US went from importing small quantities of LNG in the first 15 years of this century, to opening its first liquefaction plant in 2015, to becoming the world’s largest LNG exporter in 2023. This is a direct outcome of the shale revolution: the US Energy Information Agency recorded raw shale gas production of two trillion cubic feet (TCF) in 2007 and 34.7 TCF in 202315, meaning shale gas went from a few percentage points of total gas production to 76% in less than 20 years.
US dry gas annual production, which had stayed in a narrow 16-21 TCF range between 1969 and 2007, has nearly doubled since then and this abundance led to the emergence of the US LNG industry. Since 2021, more than 10% of US dry gas is exported as LNG. Today, the US accounts for 25% of dry gas production and 21% of LNG exports16.
This explosive development is not the only specificity of US LNG. US existing operations and projects differ from those elsewhere in the world17 because upstream and midstream are disconnected.
A typical LNG project is made of an upstream project – developing one or a few clustered gas fields – that feed a liquefaction plant (midstream) located on a seashore. It is an integrated project where the gas – or most of it – is produced to be liquefied and exported and where the same companies (often a consortium) operate upstream and midstream.
In the US, there is no integration: LNG plants have been built where it is convenient – practically more than 90% of US capacity sits on the Gulf Coast in Louisiana and Texas – and are then connected to the extensive natural gas network. In other words, the operators of the liquefaction sites are pure midstream companies: they do not drill for gas, nor do they take price risk; they only turn already produced gas into LNG, for a fee, and sell it to either end customers (mostly gas or electric utilities) or LNG traders (either pure commodity houses or oil and gas companies) at a price set through an agreed formula and linked to the initial cost of the gas, hence hedging the price risk.
This structure makes it more difficult to assess the greenhouse gas footprint of US LNG because, as we have seen, a key component and a key uncertainty is the level of methane leaks upstream. As LNG plants in the US do not source their feedstock gas from clearly identified fields but from the overall gas supply pool, this becomes an exercise in emissions attribution.
- {https://www.eia.gov/dnav/ng/hist/ngm_epg0_fgs_nus_mmcfa.htm;U.S. Natural Gas Gross Withdrawals from Shale Gas (Million Cubic Feet)}
- {https://www.eia.gov/naturalgas/data.php#summary;Natural Gas Data - U.S. Energy Information Administration (EIA)}
- At the relative exception of LNG plants in Queensland, Australia, and the soon-to-start LNG Canada plant in British Columbia
Upstream methane emissions in the US oil and gas industry
In the US, as everywhere, it is difficult to know what the real methane emissions are when oil and gas is produced and transported. Many studies – including by the IEA18, the World Bank19, numerous academics and non-governmental organisations (NGOs) – have clearly demonstrated that actual emissions are higher than reported emissions20. A critical difficulty is that emissions are most often modelled and rarely measured, and when they are measured it is often through point-in-time surveys and not continuously. Models can suffer from outdated or poor parameters and surveys do not capture (or only capture by luck) incidents when large quantities of methane are released (so called super-emitting events).
In one academic study of US oil and gas system emissions21, the authors wrote that “methane loss rates vary widely over space and time”. This translates into very diverse emissions rates depending on the location, the nature of the fields and the timing of the work. One conclusion is that the estimated weighted average methane emission level is 2.95% of natural gas production, ranging from below 1% to almost 10% depending on specific areas and geologies.
This top-down emission rate – i.e., obtained through aerial and satellite measurements - is said to be almost three times the bottom-up rate estimated by the US Environmental Protection Agency. One critical observation is that emissions are much lower in natural gas fields – where producing gas is the nature of the activity – than in oil fields where gas is a by-product22 and sometimes not welcome and poorly managed. The report adds that less than 2% of the wells are responsible for more than half of emissions.
There are many other studies on the same topics, but they all say different things. For instance, a 2024 study on US LNG provides a handy synthesis of numerous studies and concludes that ‘real life’ methane emissions should be upped by 70% in average compared to what is reported, while a 2018 study by NGO Environmental Defence Fund23 says that measured methane emissions are 60% higher than reported emissions. In addition, another 2023 study24 highlights that in the Permian basin, a large US oil producing region, certain operating companies have significantly reduced their emissions in just a few years, meaning that the vintage of data points matter.
From this, we conclude that real-world methane emissions are significantly higher than reported emissions and that they vary greatly depending on time and location.
- {https://www.iea.org/reports/global-methane-tracker-2024;Global Methane Tracker 2024 – Analysis - IEA}
- {https://www.worldbank.org/en/programs/gasflaringreduction;Global Flaring and Methane Reduction Partnership (GFMR)}
- We touched on this in this note (https://www.axa-im.lu/document/2824/view) and other studies since then have reached the same conclusion
- {https://www.nature.com/articles/s41586-024-07117-5;US oil and gas system emissions from nearly one million aerial site measurements | Nature, March 2024}
- The IEA defines an oil well as a well with a gas-to-oil ratio less or equal to six. Gas coming from mostly oil producing wells is called associated gas
- Major studies reveal 60% more methane emissions | Environmental Defense Fund
- Empirical quantification of methane emission intensity from oil and gas producers in the Permian basin - IOPscience
Methane emissions and the US LNG industry
The combination of the non-integrated structure of the US LNG industry and the uncertainties related to upstream methane emissions leads to even more confusion. While there is no question that methane emissions are high, and higher than reported, which estimates to use and how to allocate them to LNG production depends on choices that yield very different outcomes.
To further illustrate this, we selected three recent studies that aim to estimate the lifecycle greenhouse gas emissions of US LNG. In figure 7, below, we attempted to make them as comparable as possible by rebasing the emissions in kilos of CO2e per tonne of LNG. The data demonstrates that even very recent studies contain different findings, which underscores the complexity and uncertainty there is in this field.
Figure 7: US LNG intensity based on three 2024 studies
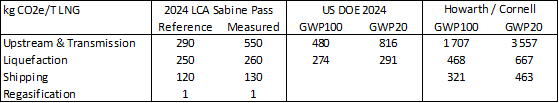
Source: AXA IM
Notes:
- GWP = Global Warming Power. GWP is used to convert methane into CO2. Methane has a higher warming effect and is equivalent to 84 CO2 over 20 years and 28.5 CO2 over 100 years
- Sabine Pass is the largest US liquefaction facility. The analysis uses GWP100, i.e. the GWP over 100 years
The first study25, published in November 2024, was funded by Cheniere Energy – the largest producer of LNG in the US and operator of the Sabine Pass and Corpus Christi facilities. The study attempts to allocate natural gas production from several basins to the feedstock of the two liquefaction plants. It distinguishes the reference case – using officially reported emissions rates, hence less than 1% – from the measured case – relying on studies measuring real world emissions.
The authors chose to use a blended rate of methane emissions, reflecting the estimated emissions from several natural gas and oil producing regions.
The second study26, published in December 2024 by the US Department of Energy, is part of a broader suite of reports on the impact of US LNG27. The authors use a methane emission rate based on reported data (0.74%), hence a level lower than what is retained in most other studies and lower than emission rates measured in ‘real life’ studies.
The third study28, published in September 2024, initiated a heated debate because its conclusions were quite different to those of earlier studies, finding that LNG is more emissions-intensive than coal on a full life-cycle analysis. The debate stems largely from the use of high level of methane leaks in each step of the LNG value chain, most notably upstream, where the author retained the elevated estimated rate of methane emissions from the Permian basin (2.8%), a largely oil producing area with significant associated gas production.
In the end, three studies published a few months apart produce very different conclusions. We believe those studies are representative of the current state of understanding of the emissions profile of US LNG:
- It is complex and confusing
- Underlying data points are a mix of estimates and measurements
- There is no time and space consistency
- The outcome depends on the choices of data points and methodologies
To put it bluntly, it would be possible to pick and choose data and methodology to fit a certain narrative, whether it is in favour of, or against, LNG.
- {https://pubs.acs.org/doi/epdf/10.1021/acssuschemeng.4c07162?ref=article_openPDF&;Gas Pathing: Improved Greenhouse Gas Emission Estimates of Liquefied Natural Gas Exports through Enhanced Supply Chain Resolution}
- {https://www.energy.gov/sites/default/files/2024-12/LNGUpdate_AppendixC_Dec2024.pdf;LNG_Update_Appendix C_December 2024,}
- LCA of NG Extraction and Power Generation: U.S. 2020 Emissions Profile
- {https://scijournals.onlinelibrary.wiley.com/doi/epdf/10.1002/ese3.1934;The greenhouse gas footprint of liquefied natural gas (LNG) exported from the United States}
Comparing the US and Qatar
We believe there are insights to be gained from comparing two LNG powerhouses, the US and Qatar. Figure 8 presents selected natural gas and LNG data for 2023 for both countries.
In Qatar, one state owned company operates 208 highly productive gas wells and a nearby LNG complex (14 trains) in a small geographical area (the state of Texas is 60 times bigger than Qatar), with a small pipeline infrastructure.
In the US, hundreds of thousands of wells produce natural gas, operated by hundreds of companies, with gas flowing through thousands of kilometres of pipelines feeding seven LNG plants29 (and more than 20 trains).
Figure 8: Comparison of Qatar and the US
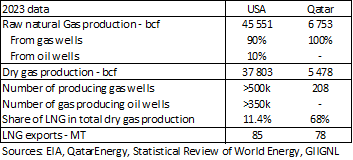
Figure 8, above, highlights how compact, efficient and productive the Qatar LNG system is relative to the US system, where liquefaction was recently added to an existing very large natural gas ecosystem. It is therefore unsurprising to see such different emission intensities for the respective LNG volumes.
- A new liquefaction plant started in December 2024
What does this mean for investors?
Concerns around the greenhouse gas footprint of LNG are linked to questions over the role of natural gas in the energy transition. In a previous note on natural gas and methane30, we concluded that natural gas could only play a role if value chain methane emissions were under control and this role is more crucial in countries where coal remains in heavy use, most notably in Asia.
The complexity and confusion around methane emissions is obviously an additional challenge. This can lead to negative publicity for both natural gas and LNG, backed by many studies and recurring instances of large methane leaks. Even if there is no question that emissions at the combustion phase greatly favour natural gas relative to coal31, the murkiness of data surrounding emissions prior to combustion opens the door to heavy - and fair – criticism of natural gas.
This applies to the entire value chain but is even more critical for LNG given the claim that it contributes to the transition by displacing coal, and even more so for US LNG given its unquestionably higher intensity.
We argue that the oil and gas industry is largely responsible for this complexity and confusion, through historically inadequate reporting and poor methane management practices. However, a growing number of oil and gas companies are now tackling methane emissions in their operated assets, while there are also initiatives that aim to collectively tackle those emissions, including the United Nations-led Oil & Gas Methane Partnership 2.0 (OGMP2.032) or the Oil & Gas Decarbonization Charter that was signed by 50 companies during the 2023 climate change conference COP28 in Dubai.
We believe however this is still insufficient, as methane emissions are not declining33, and too many companies do not properly measure methane and rely on potentially misleading emission factors. Countries and regulators also have a role to play; in recent months, new regulations aimed at reducing methane emissions in the EU34 and US35 came into play, though it is unclear whether the latter will survive the change of administration in the US.
In its Methane Tracker 2022 report, the IEA wrote that “if all producing countries were to match Norway’s emissions intensity, global methane emissions from oil and gas operations would fall by more than 90%36”. In other words, methane leaks can be reduced significantly if effort is made to do so.
The economic equation is also supportive, because methane that does not leak becomes a product that can be sold and generate cash flows.
Technological developments are key in helping reduce emissions as products and know-how improves. There are now also several satellites37 orbiting the Earth that aim to detect methane leaks, sent skyward by scientific institutions, private companies and even NGOs. They can also provide regular data points that will contribute to form a more accurate and objective understanding of methane emissions and reduce the analytical confusion.
- {https://www.axa-im.lu/document/2824/view;Is there a sweet spot for natural gas in the energy transition?, September 2021}
- In its reports, the IPCC uses an emission factor of 370g of CO2e per kWh for natural and 760 for coal. Real-life emissions are often higher, especially for coal.
- {https://ogmpartnership.com/;OGMP 2.0 – The Oil & Gas Methane Partnership 2.0}
- {https://www.iea.org/reports/global-methane-tracker-2024;Global Methane Tracker 2024 – Analysis - IEA}
- {https://energy.ec.europa.eu/topics/carbon-management-and-fossil-fuels/methane-emissions_en;Methane emissions - European Commission}
- {https://www.phmsa.dot.gov/news/usdot-advances-rule-modernize-gas-pipeline-methane-emissions-detection-requirements-0;USDOT Advances Rule to Modernize Gas Pipeline Methane Emissions Detection Requirements | PHMSA ; EPA Finalizes Rule to Reduce Wasteful Methane Emissions and Drive Innovation in the Oil and Gas Sector}
- {https://www.iea.org/reports/global-methane-tracker-2022/overview;Overview – Global Methane Tracker 2022 – Analysis - IEA}
- {https://carbonmapper.org/;For instance Methane, CO2 Detection Satellite | Greenhouse Gas | Carbon Mapper or MethaneSAT | Solving a crucial climate challenge}
Next steps for investor engagement
We believe that investors engaging with companies involved in the LNG value chain or where methane from oil and gas is relevant, should:
- Review and assess the methane management reporting, practices, performance and policy of each company individually, as they differ significantly
- Ask for a formal methane strategy, including
- Methane emissions reduction targets of at least 80%, in absolute and relative terms, on a horizon of no longer than five years
- Measuring and not modelling emissions, i.e., setting up a continuous monitoring of operated assets and cooperation with partners for non-operated assets
- Encourage participation in OGMP2.0, which has become the de facto gold standard for methane management
- Request disclosure and data points covering emissions for the entire natural gas and LNG value chains
- Ask companies to push for tighter methane rules in jurisdiction where they are too lax
We believe that a company that does not take methane seriously should not be taken seriously by investors. Methane leaks can and should be reduced – and this can be a quick and easy win for companies, investors and the environment.

Disclaimer
This document is for informational purposes only and does not constitute investment research or financial analysis relating to transactions in financial instruments as per MIF Directive (2014/65/EU), nor does it constitute on the part of AXA Investment Managers or its affiliated companies an offer to buy or sell any investments, products or services, and should not be considered as solicitation or investment, legal or tax advice, a recommendation for an investment strategy or a personalized recommendation to buy or sell securities.
Due to its simplification, this document is partial and opinions, estimates and forecasts herein are subjective and subject to change without notice. There is no guarantee forecasts made will come to pass. Data, figures, declarations, analysis, predictions and other information in this document is provided based on our state of knowledge at the time of creation of this document. Whilst every care is taken, no representation or warranty (including liability towards third parties), express or implied, is made as to the accuracy, reliability or completeness of the information contained herein. Reliance upon information in this material is at the sole discretion of the recipient. This material does not contain sufficient information to support an investment decision.
Issued in the UK by AXA Investment Managers UK Limited, which is authorised and regulated by the Financial Conduct Authority in the UK. Registered in England and Wales, No: 01431068. Registered Office: 22 Bishopsgate, London, EC2N 4BQ.
In other jurisdictions, this document is issued by AXA Investment Managers SA’s affiliates in those countries.
© 2025 AXA Investment Managers. All rights reserved