
What energy transition scenarios are and how they can be used or misused
- 28 May 2024 (7 min read)
When looking at the transition to a low-carbon economy, and to net zero, it is helpful to understand how different pathways could result in different outcomes. These outcomes are often referred to by climate bodies and research organisations as ‘scenarios’.
A useful definition of what a scenario is has been highlighted by the Network for Greening the Financial System (NGFS)1 .
It says a scenario is “a plausible description of how the future may develop based on a coherent and internally consistent set of assumptions about key driving forces (e.g., rate of technological change, prices) and relationships. Note that scenarios are neither predictions nor forecasts, but are used to provide a view of the implications of developments and actions”.
Using different scenarios is a way to explore different pathways to achieve the same outcome as well as to observe different outcomes from different assumptions. Using several scenarios can therefore be useful for decision making but any given single scenario is not a blueprint for the future and should not be used as such.
Here, we analyse some of the International Energy Agency’s (IEA) energy transition scenarios and outline what they mean for society and investors.2
- VGhlIE5ldHdvcmsgZm9yIEdyZWVuaW5nIHRoZSBGaW5hbmNpYWwgU3lzdGVtIGlzIGNvbXBvc2VkIG9mIG1vcmUgdGhhbiAxMDAgY2VudHJhbCBiYW5rcyBhbmQgZmluYW5jaWFsIHJlZ3VsYXRvcnMuIEl0cyBzY2VuYXJpb3MgYXJlIHVzZWQgdG8gc3RyZXNzIHRlc3QgdGhlIGZpbmFuY2lhbCBzeXN0ZW0gZm9yIHBvdGVudGlhbCBjbGltYXRlIGNoYW5nZSBpbXBhY3Rz
- V2UgaGF2ZSBjaG9zZW4gdGhlIElFQeKAmXMgc2NlbmFyaW9zIGFzIHRoZXkgYXJlIGFtb25nc3QgdGhlIG1vc3QgaGlnaGx5LXJlZ2FyZGVkLCB0aG91Z2ggaXQgc2hvdWxkIGJlIG5vdGVkIHRoYXQgbWFueSBvdGhlciBvcmdhbmlzYXRpb25zIGhhdmUgZGV2ZWxvcGVkIHVzZWZ1bCBzY2VuYXJpb3MsIGluY2x1ZGluZyB0aGUgTkdGUywgSW50ZXJuYXRpb25hbCBNb25ldGFyeSBGdW5kIGFuZCBPcmdhbmlzYXRpb24gZm9yIEVjb25vbWljIENvLW9wZXJhdGlvbiBhbmQgRGV2ZWxvcG1lbnQsIGFtb25nIG90aGVycy4=
The IEA’s scenarios:
- NZE: Net Zero Energy scenario, aligned with 1.5°C warming above pre-industrial levels - a normative scenario as it works backwards from a defined outcome3
- APS: Announced Pledges Scenario, aligned with 1.7°C of warming – implements countries’ mid-term action plans to cut emissions (their Nationally Determined Contributions) and long-term net zero targets
- STEPS: Stated Policies Scenario, aligned with 2.4°C of warming – Implements only current policies and actions
NZE and APS are both compatible with the Paris Agreement’s goal of “holding the increase in the global average temperature to well below 2°C above pre-industrial levels and pursuing efforts to limit the temperature increase to 1.5°C above pre-industrial levels”4 .
While both are Paris Agreement compatible, NZE has become the more prominent, central scenario in many analyses. By contrast, STEPS is a ‘business as usual’ scenario and is even not a net-zero scenario, as temperatures continue to increase. As such, while we quote it, we do not believe it can be used as a reference.
- e2h0dHBzOi8vd3d3LmF4YS1pbS5jb20vZG9jdW1lbnQvMjk4OS92aWV3O0ZvciBhIGRldGFpbGVkIGFuYWx5c2lzIHNlZSBUaGUgSUVB
- PGEgaHJlZj0iaHR0cHM6Ly91bmZjY2MuaW50L3NpdGVzL2RlZmF1bHQvZmlsZXMvZW5nbGlzaF9wYXJpc19hZ3JlZW1lbnQucGRmIj5QYXJpcyBBZ3JlZW1lbnQsIFVuaXRlZCBOYXRpb25zLCAyMDE1PC9hPg==
Figure 1 is a clear illustration that there is not one 1.5°C scenario but many. It plots the IEA’s NZE (green line) against tens of scenarios (grey lines) used by the Intergovernmental Panel on Climate Change (IPCC). The APS (in orange) is added for comparison.
Figure 1: Greenhouse gas emissions in IEA scenarios compared to IPCC 1.5°C scenarios
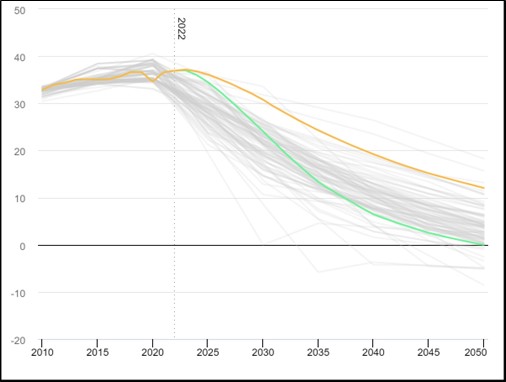
Source: Understanding GEC Model scenarios – Global Energy and Climate Model, IEA, retrieved March 2024.
Figure 2 is another and more precise illustration that scenarios with the same outcome can be built with different bricks. This contrasts 2050’s expected total final energy consumption in the IEA’s NZE (in green) with the same metric in 18 comparable scenarios from the IPCC (in blue). This metric is but one brick in those scenarios, and there are strong - sometimes drastic - differences in the other bricks. This shows that focusing on one brick at the exclusion of the others only provides a partial view and understanding of a scenario.
In other words, it is possible to reach the same destination via different paths. This means that different political and economic choices can be made to potentially achieve the same goal.
Figure 2: Total Final Energy Consumption in 2050 in exajoules
Source: Net Zero by 2050 - A Roadmap for the Global Energy Sector, IEA, May 20215
- IFdlIHJlY29tbWVuZCByZWFkaW5nIHBhZ2VzIDYyLTY0IG9mIHRoZSByZXBvcnQgZm9yIGEgYnJvYWRlciBhbmFseXNpcyBvZiB0aGlzIHBvaW50
Oil and gas in energy transition scenarios
The IEA urged there to be “no new oil and gas fields” in its 2021 report “Net Zero by 2050: A Roadmap for the Global Energy Sector”6 , a view that has been repeated often since. In its September 2023 update7 , the IEA reiterated its conclusion, but with a slight twist, saying that “there is no need for new long lead time upstream oil and gas conventional projects”.
In its NZE scenario, demand for fossil fuels drops rapidly thanks to the rapid deployment of technologies that consume less fossil fuels, as well as strong efficiency improvements and behavioural changes. As a result, existing fields are deemed sufficient to meet demand.
The same scenario includes investment in existing and approved projects for oil supply8 (see Figure 3). In APS and STEPS, there is a need for investments in new supply, because demand does not fall sufficiently (and indeed does not fall at all in STEPS). The same applies to natural gas, with the same observation.
There is clearly more oil produced in APS than in NZE: in its World Energy Outlook 2023, the IEA forecasts oil production in 2050 at 24.3 million barrels in NZE and 54.8 million in APS. This compares to more than 100 million barrels in 2023.
This may be surprising and even counter-intuitive but meeting the goal of the Paris Agreement and developing new oil and gas fields are not mutually exclusive. However, it is quite clear that achieving 1.5°C and developing new fields are not compatible. Figure 3 highlights that the quantum of actions to be taken to achieve a 1.5°C outcome is significantly higher than to achieve 1.7°C. There is no linearity here.
Figure 3: Oil supply by scenario, 2010-2050
Source: The Oil and Gas Industry in Net Zero Transitions, IEA, November 2023
- PGEgaHJlZj0iaHR0cHM6Ly9pZWEuYmxvYi5jb3JlLndpbmRvd3MubmV0L2Fzc2V0cy9kZWViZWY1ZC0wYzM0LTQ1MzktOWQwYy0xMGIxM2Q4NDAwMjcvTmV0WmVyb2J5MjA1MC1BUm9hZG1hcGZvcnRoZUdsb2JhbEVuZXJneVNlY3Rvcl9DT1JSLnBkZiI+TmV0IFplcm8gYnkgMjA1MCAtIEEgUm9hZG1hcCBmb3IgdGhlIEdsb2JhbCBFbmVyZ3kgU2VjdG9yLCBJRUEsIE1heSAyMDIxPC9hPg==
- PGEgaHJlZj0iaHR0cHM6Ly9pZWEuYmxvYi5jb3JlLndpbmRvd3MubmV0L2Fzc2V0cy85YTY5OGRhNC00MDAyLTRlNTMtOGVmMy02MzFkODk3MWJmODQvTmV0WmVyb1JvYWRtYXBfQUdsb2JhbFBhdGh3YXl0b0tlZXB0aGUxLjVDR29hbGluUmVhY2gtMjAyM1VwZGF0ZS5wZGYiPk5ldCBaZXJvIFJvYWRtYXA6IEEgR2xvYmFsIFBhdGh3YXkgdG8gS2VlcCB0aGUgMS41IMKwQyBHb2FsIGluIFJlYWNoLCBJRUEsIFNlcHRlbWJlciAyMDIzPC9hPg==
- PGEgaHJlZj0iaHR0cHM6Ly9pZWEuYmxvYi5jb3JlLndpbmRvd3MubmV0L2Fzc2V0cy9mMDY1YWU1ZS05NGVkLTRmY2ItOGYxNy04Y2VmZmRlOGJkZDIvVGhlT2lsYW5kR2FzSW5kdXN0cnlpbk5ldFplcm9UcmFuc2l0aW9ucy5wZGYiPlRoZSBPaWwgYW5kIEdhcyBJbmR1c3RyeSBpbiBOZXQgWmVybyBUcmFuc2l0aW9ucywgSUVBLCBOb3ZlbWJlciAyMDIzPC9hPg==
The IEA forecasted oil demand till 2028, in its 2023 report Oil 20239 . We took this forecast and plotted it against the short-term leg of the IEA’s scenarios. Figure 4 shows that what the IEA expects from the real world is very different from what it models in its transition scenarios. Indeed, in the real world, oil demand was at a record high in 2023 and is expected to continue to rise, albeit slowly.
Figure 4: Oil and liquids demand vs scenarios, in million barrels per day
Sources: Oil 2023, June 2023; World Energy Outlook 2023, October 2023; IEA
Real world versus scenarios
Figure 5 shows predicted future greenhouse gas emissions depending on different policies, from those in place currently to pledges, targets and potential scenarios – and the temperature outcomes of actions taken. The data was updated after the United Nations climate change conference COP28 in late 2023. The outcome of the first global stocktake - the final document published at the end of COP2810 - states that we “are not yet collectively on track towards achieving the purpose of the Paris Agreement and its long-term goals11 ”. Indeed, this analysis and many others, including by the IPCC, conclude that the world is on track for a temperature increase of 2.5°C or above.
Figure 5: Emission pathways and temperature outcomes post-COP28
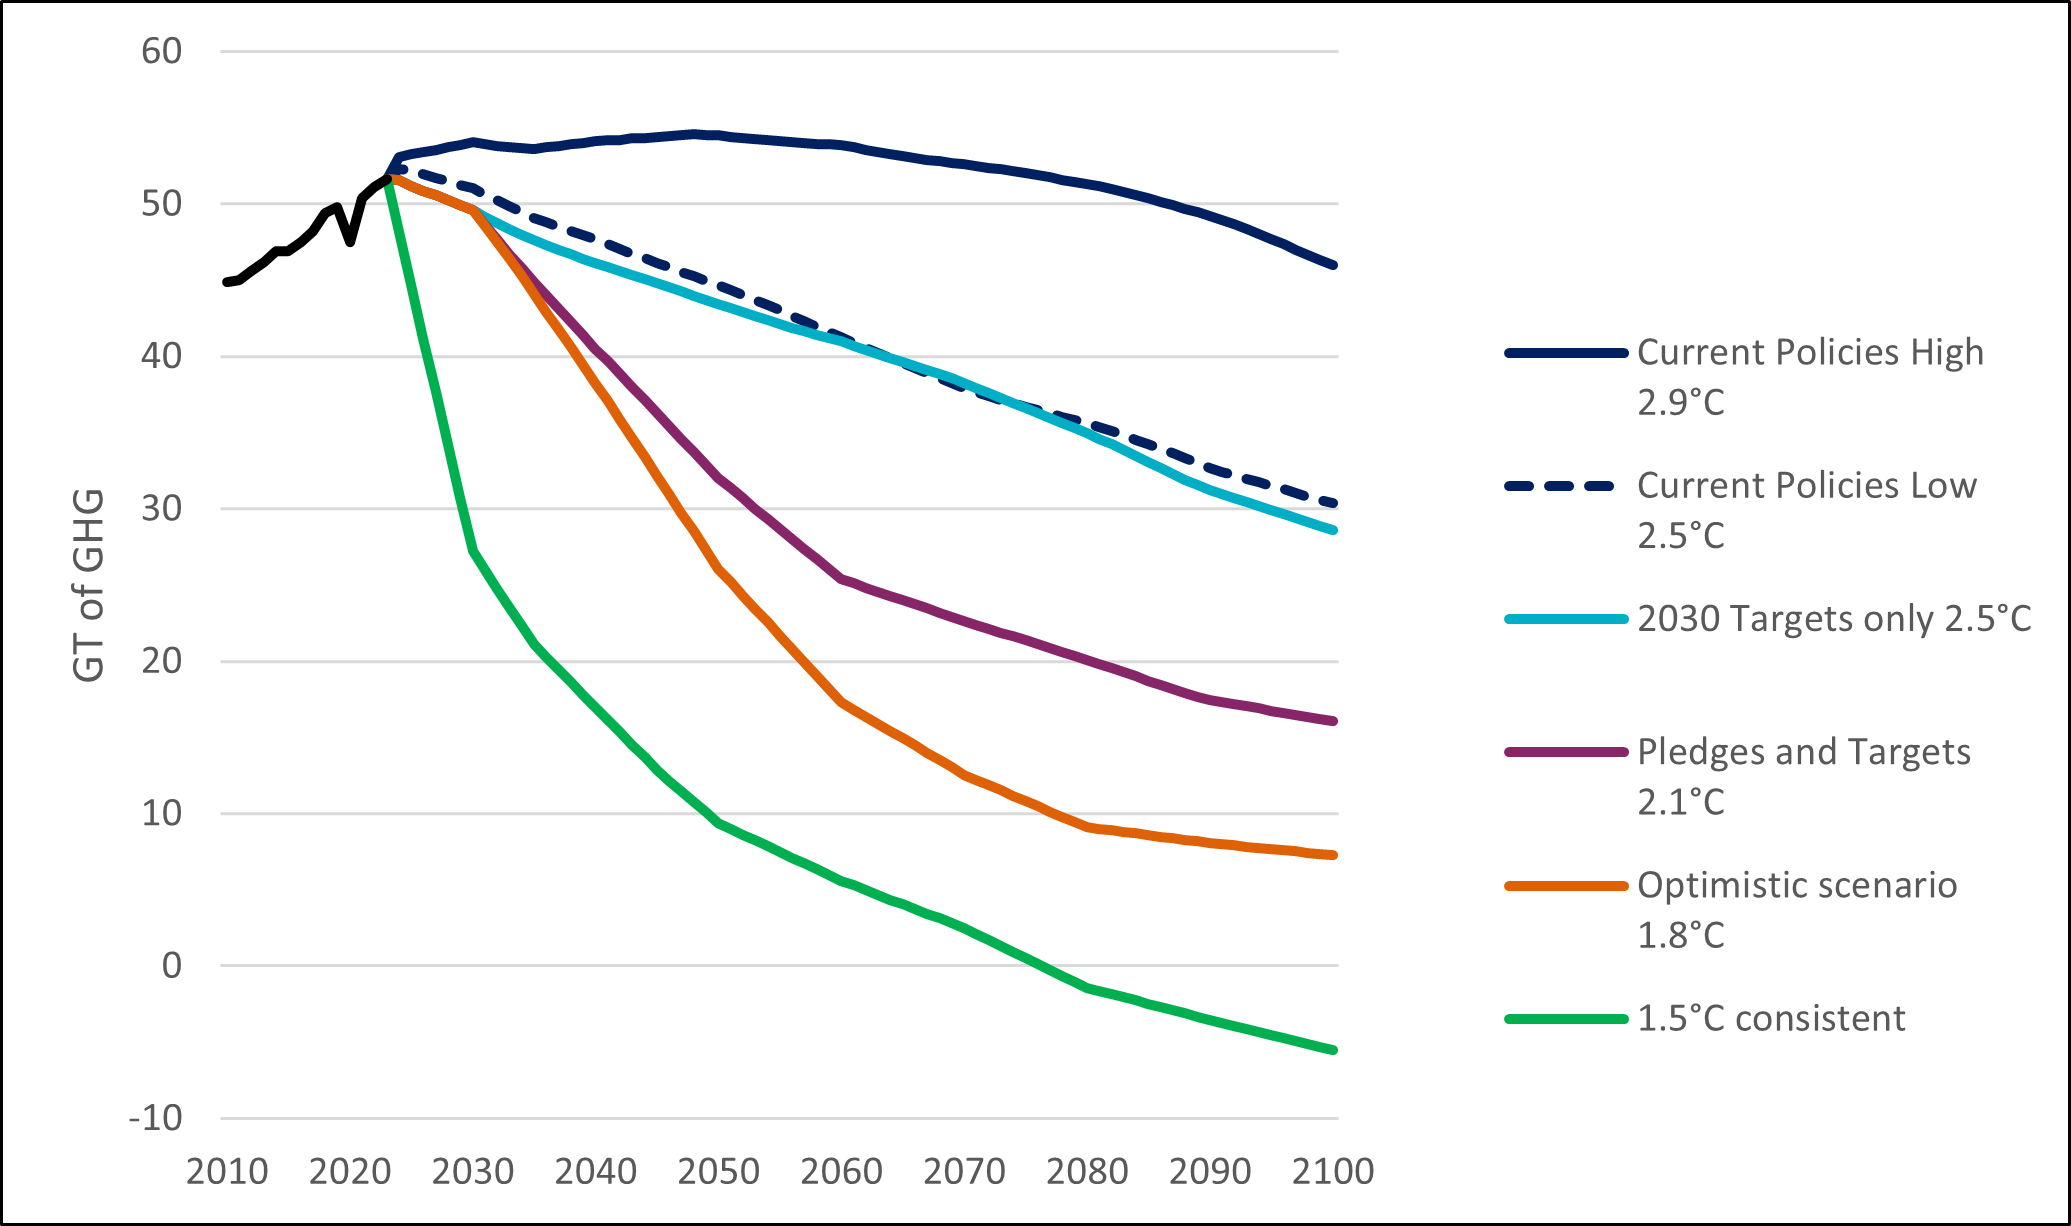
Sources: World Resources Institutes; Climate Action Tracker; AXA IM. GT of GHG: gigatonnes of greenhouse gases
Many debates in the energy transition circle around the opposition between the real world – what is happening with current public policies, corporate strategies, and individual choices - and scenarios – what should happen to achieve a given outcome. But this debate has largely become centred on achieving the 1.5°C Paris Agreement goal and the IEA’s NZE scenario is often viewed as the blueprint to do so.
Focusing on a desirable but out of reach scenario – or only reachable with economic and societal changes that have not been embraced so far – carries the risk of creating unachievable expectations and triggering a pushback from parts of society and certain stakeholders. It also creates the risk of having to potentially back out of a totemic goal.
We believe the key challenge is to bridge the gap between the real world – where clearly not enough is being done - and scenarios that are sufficiently ambitious and achievable. Public policies are essential to do so, but all stakeholders – public and private, companies and people – must participate to achieve an ambitious but reachable outcome.
- PGEgaHJlZj0iaHR0cHM6Ly9pZWEuYmxvYi5jb3JlLndpbmRvd3MubmV0L2Fzc2V0cy82ZmY1YmViNy1hOWY5LTQ4OWYtOWQ3MS1mZDIyMWI4OGM2NmUvT2lsMjAyMy5wZGYiPk9pbCAyMDIzIEFuYWx5c2lzIGFuZCBmb3JlY2FzdCB0byAyMDI4LCBJRUEsIEp1bmUgMjAyMzwvYT4=
- PGEgaHJlZj0iaHR0cHM6Ly91bmZjY2MuaW50L3NpdGVzL2RlZmF1bHQvZmlsZXMvcmVzb3VyY2UvY21hMjAyM19MMTdfYWR2LnBkZiI+T3V0Y29tZSBvZiB0aGUgZmlyc3QgZ2xvYmFsIHN0b2NrdGFrZTsgMTMgRGVjZW1iZXIgMjAyMzwvYT4=
- VGhlIGdvYWwgaXMgb2Yg4oCcaG9sZGluZyB0aGUgaW5jcmVhc2UgaW4gdGhlIGdsb2JhbCBhdmVyYWdlIHRlbXBlcmF0dXJlIHRvIHdlbGwgYmVsb3cgMsKwQyBhYm92ZSBwcmUtaW5kdXN0cmlhbCBsZXZlbHMgYW5kIHB1cnN1aW5nIGVmZm9ydHMgdG8gbGltaXQgdGhlIHRlbXBlcmF0dXJlIGluY3JlYXNlIHRvIDEuNcKwQyBhYm92ZSBwcmUtaW5kdXN0cmlhbCBsZXZlbHPigJ0=
Potential rewards for investors
We believe it is more relevant for investors to use a range of scenarios than just one to inform their investment strategies. The scenarios also ought to be ambitious, because the transition is an ambitious endeavour.
Exclusively focusing on scenarios which - at least for now - look out of reach can be misleading because it could lead to disconnecting portfolios from real economic conditions, with potentially an impact on risk-return profiles. In addition, using such scenarios to exclude entire sectors to make portfolios look greener while the world is unchanged is in our view a form of greenwashing.
We believe that combining robust demands for companies with a large environmental footprint and engaging with them is a better approach that in the long-term could reap rewards for companies, investors – and the wider world.
